Early Childhood Development
(Kindergarten Readiness)
A child’s readiness when they start kindergarten is a strong predictor of their future outcomes. Children who enter with early communication and language skills as well as basic knowledge of math and reading concepts, social competence and emotional maturity, are more likely than their peers without these skills to experience later academic success, attain higher levels of education and secure employment.1
First 5 Orange County creates opportunities for children to develop these early skills, providing a strong foundation for a lifetime of learning and success. This includes our work to increase well-child visits and developmental screening, HealthySteps clinics, and Kid Builder activities.
We use Early Development Index (EDI) data to measure young children’s readiness for kindergarten, defined as the proportion of children who are on track (25th percentile or higher) on the five EDI domains: physical health, social competence, emotional maturity, language and cognitive development, and communications skills and general knowledge.


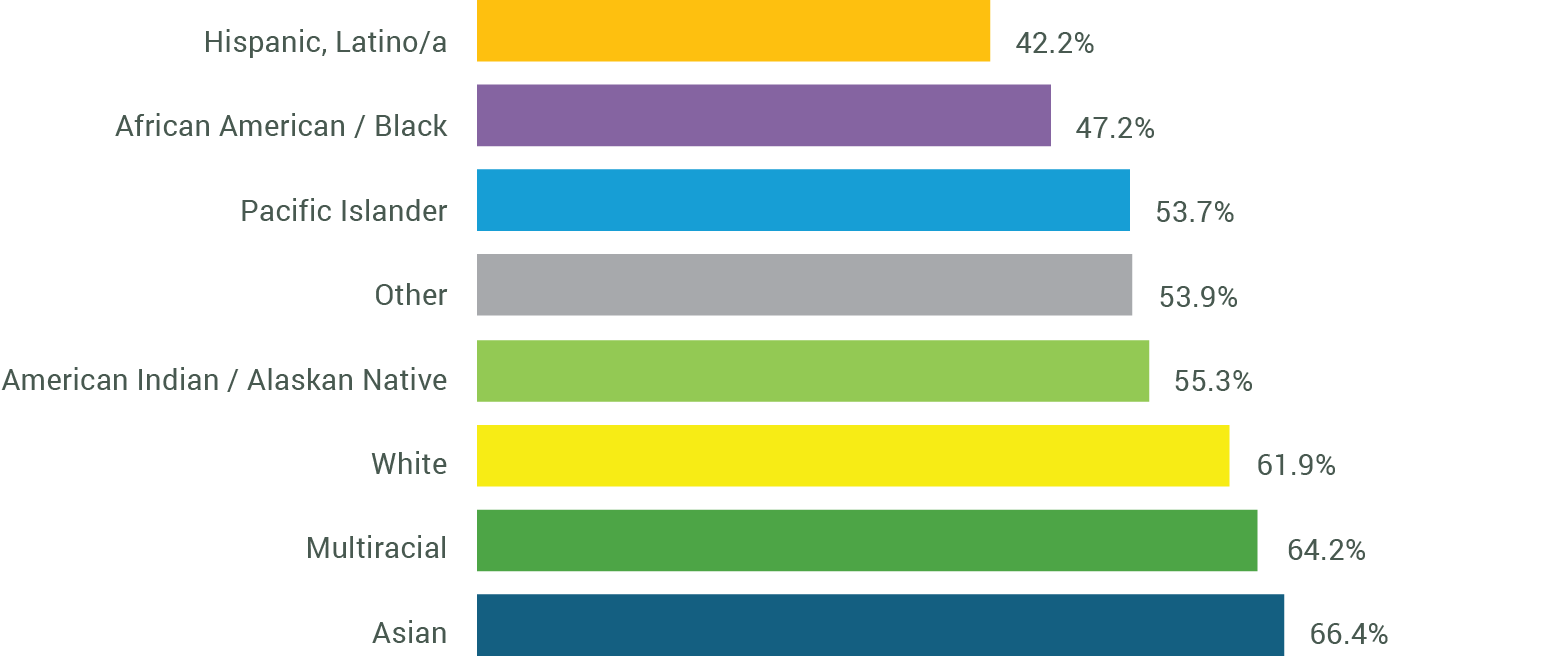
Hispanic children are less likely to be on track on all developmental domains
The percentage of children on track on all domains (kindergarten readiness) varies by race and ethnicity with Hispanic and African American children below the county average. The range in kindergarten readiness by race and ethnicity contributes to an equity gap score of 1.6, where Asian students are more than one and a half times as likely to be ready for kindergarten as Hispanic students.
Source: Early Development Index
1 Duncan, G. J., Dowsett, C. J., and Claessens, A. (2007). School readiness and later achievement. Developmental Psychology, 43(6), 1428-1446.
Early childhood development in
Engaged Neighborhoods
First 5 Orange County invests in community collaboratives (Engaged Neighborhoods), supporting them to engage and empower families, connect families to resources, and connect resource providers to each other. When we do this successfully, neighborhoods will have families that are empowered changemakers, advocating for solutions to issues facing their community, along with the infrastructure to support healthy children and equitable access to services.
First 5 OC currently funds four Engaged Neighborhoods: Growing Up Garden Grove, La Habra Little Learners, Network Anaheim: Learn Well, and Santa Ana Early Learning Initiative. Each Engaged Neighborhood has identified specific neighborhoods of focus based on their young children’s unique developmental needs.
We can see progress in these communities by measuring children’s readiness for kindergarten, defined as the proportion of children who are on track (25th percentile or higher) on the five EDI domains. Currently, all the neighborhoods of focus are below the county average, and First 5 OC and the Engaged Neighborhoods are working to improve early childhood development in these specific communities.

While there was a range in the proportion of children on track on all domains in the Engaged Neighborhoods—ranging from a high of 46% in the Juarez neighborhood to a low of 28% in the Rancho neighborhood—these proportions are still below the county average (52.7%).
Between 2015 and 2022, the trend in the Engaged Neighborhoods was mixed, but most neighborhoods saw an improvement:
- Network Anaheim: Learn Well: Two of the three focus neighborhoods improved
- Garden Grove: There was a decline in the proportion of children on track on all domains within the focus neighborhood
- La Habra: All three focus neighborhoods improved
- Santa Ana: There was an improvement in the proportion of children on track on all domains citywide
The percentage of children on track on all domains has a mixed trend in OC’s Engaged Neighborhoods

Source: Early Development Index
Social and Emotional Development in
Young Children
Children’s social and emotional development is influenced by the quality of nurturing attachment and stimulation that a child experiences in the earliest years of their lives. A relationship with a consistent, caring, and attuned adult is essential for healthy social and emotional outcomes in young children. Early and appropriate interventions that focus on social and emotional development can help to mitigate the effects of negative experiences in ways that lead to improved cognitive and social-emotional outcomes.2
Many of First 5 OC’s initiatives build and strengthen social and emotional development, including prenatal services, home visiting, Family Wellness Plans, doulas and father engagement. We can measure progress in this area through the social-emotional index of the Early Development Index.


Asian students are more than 1.5 times as likely to be ready for kindergarten as Hispanic students
The percentage of children on track on all domains (kindergarten readiness) varies by race and ethnicity with Hispanic and African American children below the county average. The range in kindergarten readiness by race and ethnicity contributes to an equity gap score of 1.6, where Asian students are more than one and a half times as likely to be ready for kindergarten as Hispanic students.
2 “Social-Emotional Competence of Children Protective and Promotive Factors.” Center for the Study of Social Policy, Center for the Study of Social Policy, cssp.org/.
Postpartum Depression Screening
and Follow Up
About one in seven women can develop postpartum depression.3 If untreated, postpartum depression can lead to chronic depression for the mother, precipitate depression for other family members, and impact mother-baby bonding. The child can develop behavioral and emotional problems, delays in language development, sleep and eating difficulties, and attention deficit/hyperactivity disorder. The earlier a woman is identified with maternal depression, the earlier she can receive treatment.
First 5 OC invests in a range of services to support families before and after birth including maternal depression screenings and follow up. We can measure progress by tracking the percentage of deliveries in which Medi-Cal members are screened for clinical depression while pregnant and, if screened positive, received follow-up care. Data are available through the California Department of Health Care Services, Medi-Cal Managed Care Quality Improvement Reports. Note that 2022 is the first year these data are collected, therefore only baseline information is presented.
Many of First 5 OC’s initiatives build and strengthen social and emotional development, including prenatal services, home visiting, Family Wellness Plans, doulas and father engagement. We can measure progress in this area through the social-emotional index of the Early Development Index.


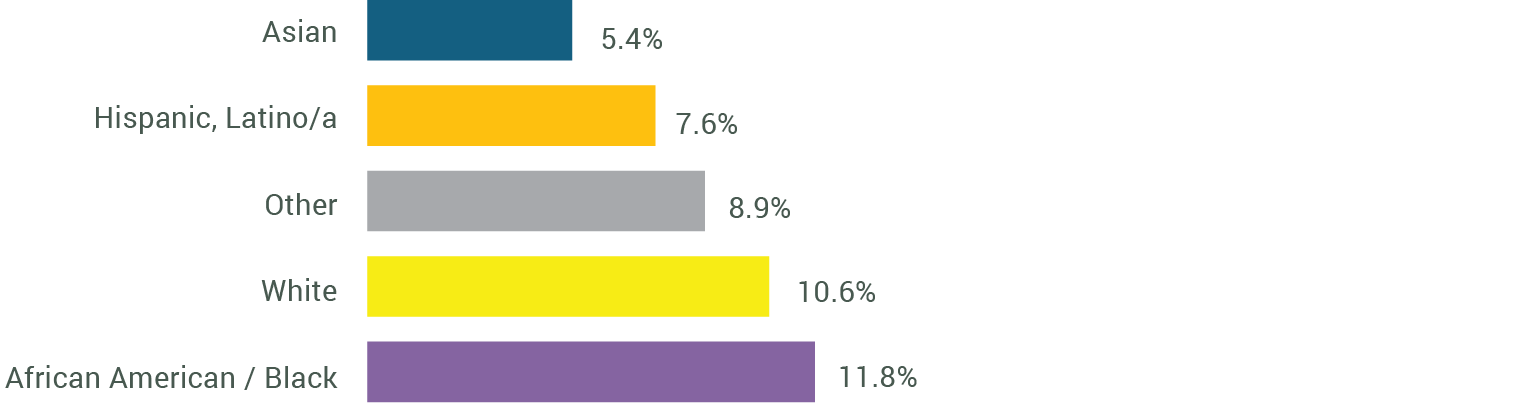
In 2022, Black or African American Medi-Cal members were more than twice as likely to have received a postpartum depression screening than Asians
Postpartum depression screenings vary significantly by race and ethnicity. The range in postpartum depression screenings by race/ethnicity contributes to an equity gap score of 2.2, where Black or African American Medi-Cal members are more than twice as likely as Asians to have received a prenatal depression screening (11.8% and 5.4%, respectively).
3 Mughal S, Azhar Y, Siddiqui W. Postpartum Depression. [Updated 2022 Oct 7]. In: StatPearls [Internet]. Treasure Island (FL): StatPearls Publishing; 2024 Jan-. Available from: https://www.ncbi.nlm.nih.gov/books/NBK519070/
Early Prenatal
Care
Increasing care in the first trimester of pregnancy can improve birth outcomes. Babies born to mothers who do not get early prenatal care are three times more likely to have low birth weight and five times more likely to die than those born to mothers who do get care. Access to early, regular, and culturally appropriate prenatal care improves the chances of a healthy pregnancy and delivery and can help reduce health inequities.4
First 5 OC’s initiatives aimed at improving birth outcomes include prenatal services, home visiting, HealthySteps clinics and promotion of well-child visits and developmental screens, Family Wellness Plans, and capacity building for doulas and Black Infant Health.

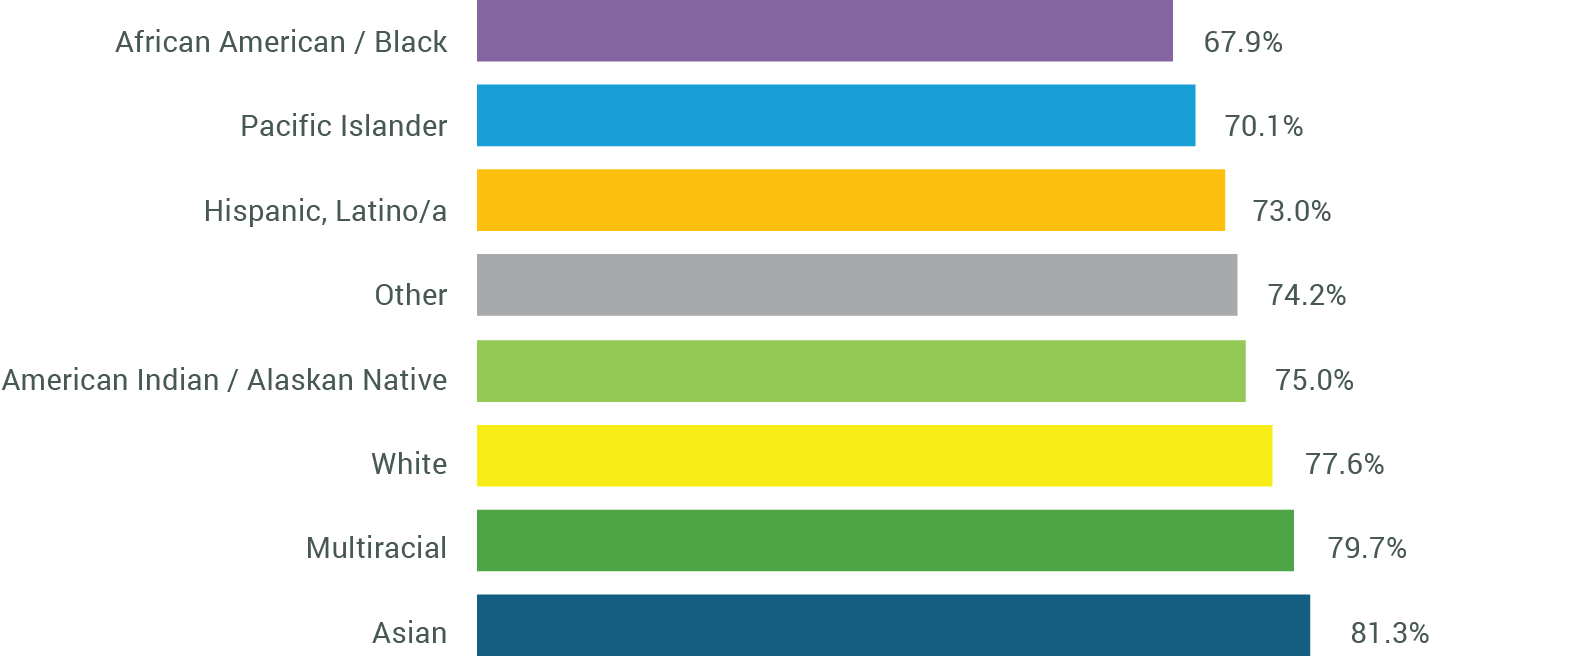
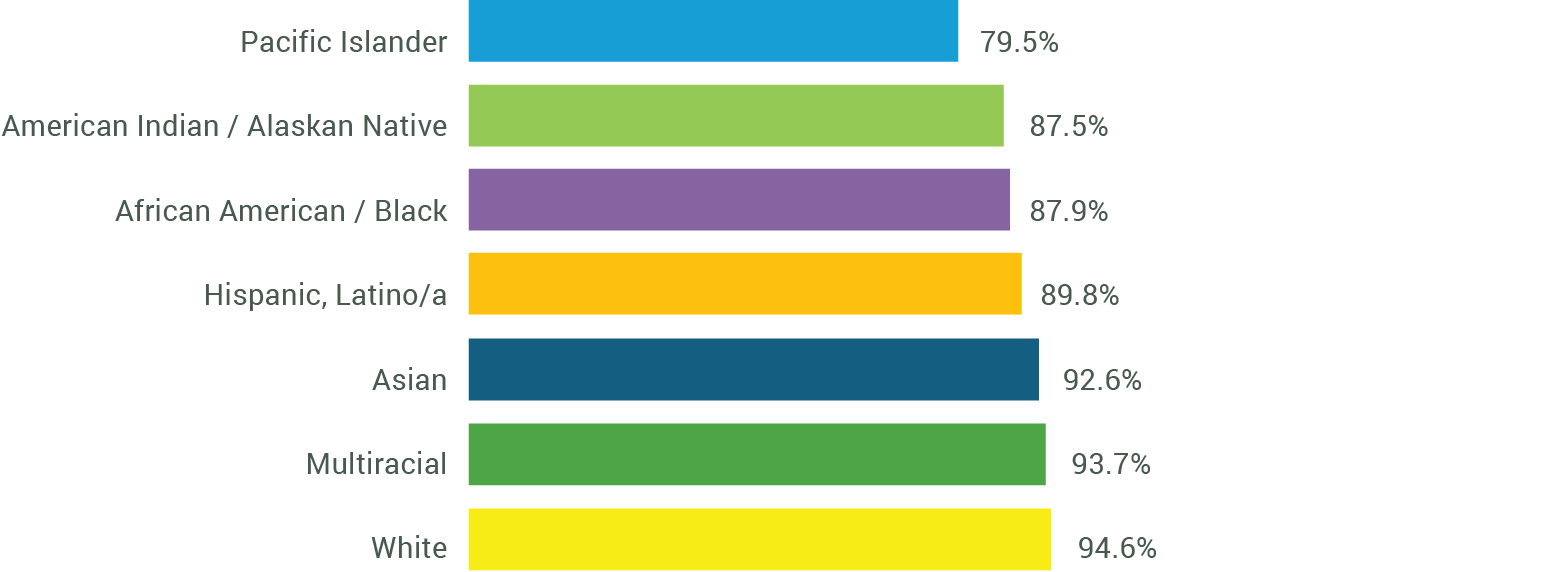
Early prenatal care rates continue to improve


Pacific Islanders least likely to receive early prenatal care
In 2019-2021, White mothers/parents had the highest early prenatal care rate (94.6%), followed by mothers/parents who were more than one race (93.7%). At 79.5%, Pacific Islander mothers/parents had early prenatal care rates below the Healthy People 2030 objective of 80.5%. While disparities persist, these relatively high levels of early prenatal care for all race/ethnic groups contribute to a low Equity Gap Score of 1.2.
Engagement in the child welfare system for children ages 0 – 3
Child maltreatment and neglect can have long-term effects on health and wellbeing and are serious public health problems. Statistics show that rates of abuse and neglect are often highest among infants and young children.5 In 2023, 14% of substantiated child abuse reports in Orange County were for children ages younger than age three.
Reducing children’s exposure to violence can support their healthy development and mitigate the long-term negative effects that abuse and the corresponding engagement in the child welfare system can have on children and their families. First 5 OC employs a variety of strategies that have been shown to effectively reduce child maltreatment and neglect including enhancing supportive parenting through home visitation, parenting classes, and peer support; increasing quality child care and education; investing in early intervention and prevention; and supporting neighborhoods to empower families and provide economic supports.

In 2023, the substantiated abuse rate in Orange County for children younger than three years was 9.95 per 1,000. This figure has decreased since 2019, when the substantiated rate of abuse was 11.88.
Since 2019, there was a 16% decline in the rate of substantiated reports of abuse and neglect for children younger than three years in Orange County.

5 National annual child abuse statistics cited from U.S. Administration for Children & Families, Child Maltreatment 2022.
Increased early
developmental screening
One in six children in the U.S. under the age of three have a developmental delay, with estimates that more than 80% of these children do not receive the vital early intervention services that can help them close that developmental gap.6 Unfortunately, many children are not identified with delays until they are in school, by which time significant delays might have occurred and opportunities for treatment have been missed. Research consistently shows that the earlier a delay is recognized, and intervention is begun, the better the chance the child has of substantial improvement.
First 5 OC is working to increase well-child visits, developmental screens and linkage to developmental services for young children including through the expansion of HealthySteps clinics, facilitation of the countywide collaborative Detect & Connect OC which is currently focused on Speech and Language and autism services, and Kid Builder developmental activities. Given the challenges in reporting information on children who receive developmental screenings, Medi-Cal Claims/Encounter data provides an accurate reporting of children receiving development screenings across the county.

The proportion of children under age three receiving a developmental screening has dropped since 2021, but is still higher than in 2020


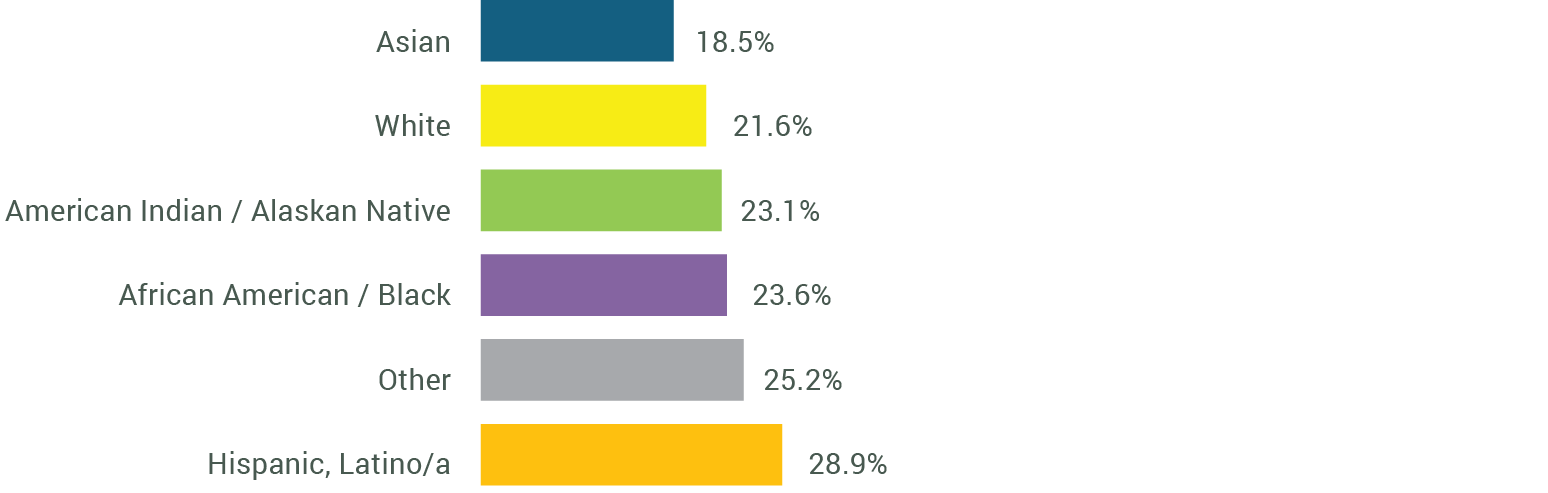
Almost one in three Hispanic children under age 3 received a developmental screening
Developmental screenings vary by race and ethnicity, with the range contributing to an equity gap score of 1.8. At a screening rate of 28.9%, Hispanic children under 3 years are almost twice as likely as Asians to have a developmental screening (18.5%).
Licensed child care
capacity
In Orange County, 60% of children younger than age 5 have all parents working. Yet, there are approximately 21 infants/toddlers for each licensed slot available. If only one-third of infants and toddlers in Orange County required child care, there would be enough licensed capacity for 1 in 7 children. Increasing the number of slots available for infants and toddlers will help provide a stable, secure setting to support the health, social and emotional development for children and their families.
First 5 OC is addressing the lack of child care by funding workforce development programs that train new child care providers in both business and child development, and facilitate them getting their license to provide child care.

| Center-Based Licensed Capacity, Number of Slots | |||
| 2020 | 2023 | Change | |
| Infant/Toddler | 4,476 | 5,228 | 17% |
| Preschool | 54,274 | 53,786 | -1% |
| Overall | 58,750 | 59,014 | 0.4% |
Children younger than age six are also served at family child care (FCC) homes. There was a 10% decline in the number of licensed slots at FCC homes between 2020 and 2023. However, FCC homes serve children 12 and younger, so we cannot distinguish the proportion of children who are under age six.
| Family Child Care Home Licensed Capacity, Number of Slots | |||
| 2020 | 2023 | Change | |
| Family Child Care Homes | 12,194 | 10,982 | -10% |
As of January 2024, new regulations went into effect that will impact our ability to present child care capacity data moving forward, as licensing information will now encompass all children served younger than age 13 (as opposed to breaking out infant/toddler, preschool-age, and school-age). Because child care capacity is an important area to monitor, we will continue to assess and identify potential measures to include in future years’ updates.
Reliance on
Tobacco Taxes
First 5 Orange County was created as a result of Proposition 10, the California Children and Families Act of 1998, which added a 50-cent sales tax on tobacco products sold in California. Prop 10 required that funds raised be used to support education, health and child development programs for children from the prenatal stage through age 5. Since our inception more than 20 years ago, smoking rates have declined significantly, which is a positive public health outcome, but results in a declining revenue source for First 5 OC. Our tobacco tax revenue declined from $44.5 million in 2001 to $20.1million in 2023.
First 5 OC has pivoted in recent years to secure alternative funding sources so that we can continue to champion young children and families as a funder of research-based services, system capacity builder, and facilitator of cross-agency coordination.
We can track our reliance on tobacco taxes by measuring the proportion of First 5 OC revenue from tobacco taxes.

In 2023, tobacco taxes made up 80% of all First 5 OC revenue, down from 88% in 2022.

Equity Gap Score
The Equity Gap Score is a statistic that documents the scale of the racial or ethnic disparity for a particular indicator.
It measures the difference between the highest and lowest rates for a given indicator.
For example, a score of 2.0 indicates that the rate of the highest performing group is twice as high as the rate of the lowest performing group, whereas a score of 3.0 suggests that the factor of difference is three times higher. A score of 1.0 implies that little-to-no racial or ethnic inequity is apparent in the data, while a score above 1.0 implies an increasing level of inequity as the number grows.
A few important notes about the Equity Gap Score:
- The Equity Gap Score does not assume that everyone should have the same outcome. Rather, it is based on the core value that different outcomes should not be associated with a group’s racial or ethnic identity.
- If the group with the lowest or highest rate is the “other” or “unknown” group, the gap score is calculated on the next lowest or highest rate. The rationale for not including other or unknown in the Equity Gap Score calculation is that this category lacks meaning from a policy response perspective; it is not clear where to target interventions when the identity of the group is variable or unknown.
- Shrinking Equity Gap Scores will show equity is improving; growing Equity Gap Scores will indicate the opposite.